Online Flight Logging
Connect DroneRover to PolarWave Data to automatically upload every scan to the cloud. Once connected, each automatic or manual mission is logged to your account, where you can review flight paths, heat maps, and raw sensor data from any browser.
Step 1 — Create a PolarWave Account
- Open your browser and go to www.polarwave.app.
- Click Create an account on the login page.
- Fill in your name, email, and password, then click Sign up.
Step 2 — Confirm Your Email
Check your inbox for a confirmation email and click the confirmation button or link.
If you don't see the email, check your Spam or Junk folder.
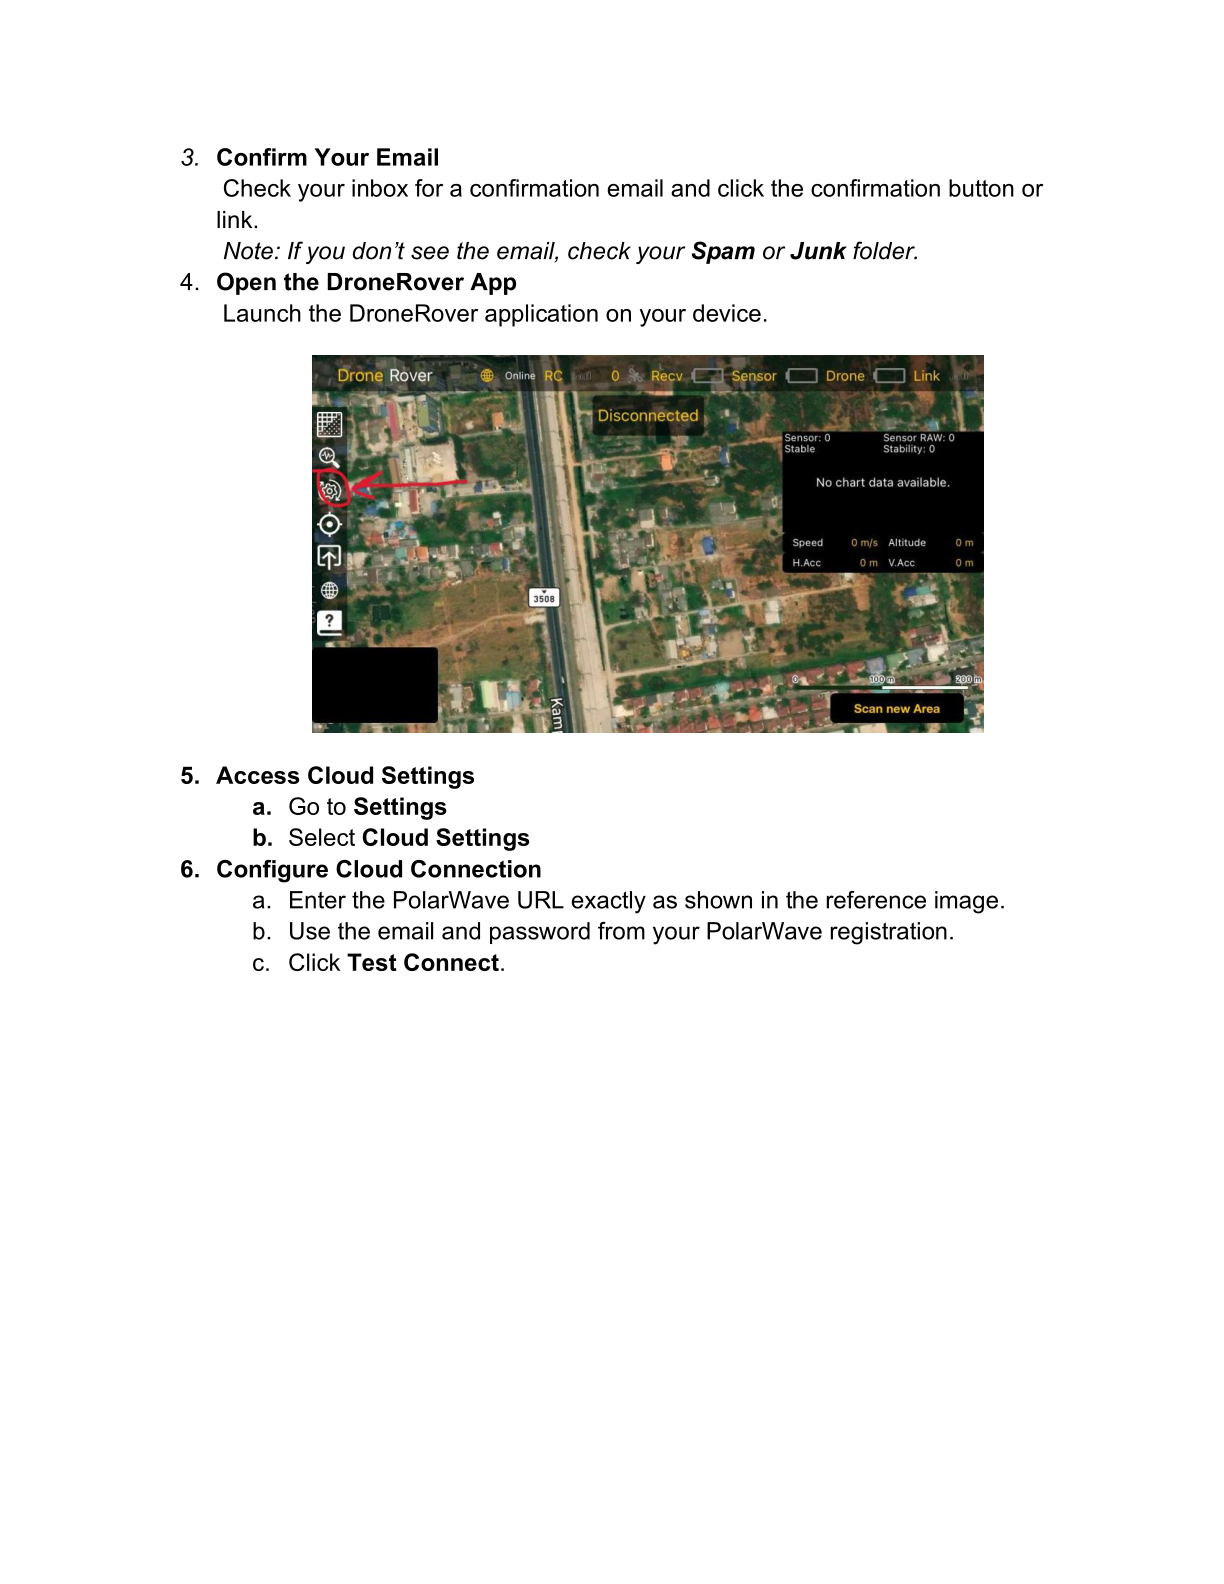
Step 3 — Open the DroneRover App
Launch the DroneRover application on your device.
Step 4 — Access Cloud Settings
- Go to Settings.
- Select the Cloud Settings tab.
Step 5 — Configure the Cloud Connection
Fill in the Cloud Settings form:
| Field | Value |
|---|---|
| URL | https://polarwave.app/api |
| Login | Your PolarWave email address |
| Password | Your PolarWave password |
| Update interval | 2 s (default) |
Click Test Connection.
If the response shows "Authenticated successfully", DroneRover is now connected to PolarWave Data.
Step 6 — Start Scanning
From now on, every scan — in automatic or manual mode — is automatically uploaded to your PolarWave Data account in real-time.
Viewing Your Scans Online
- Log in to www.polarwave.app.
- Click Flight Log in the left-hand menu.
- You will see a list of all your scan missions with the following metadata:
| Column | Description |
|---|---|
| Mission ID | Unique identifier for the scan |
| Device ID | Your DroneRover device identifier |
| Time | Timestamp of the scan |
| Altitude mode | Constant or Terrain |
| Altitude | Flight altitude in metres |
| Flight mode | Manual or Automatic |
| Speed | Drone speed during scan |
| Threshold | Sensor sensitivity threshold used |
| Sensitivity limit | Stability limit setting used |
Per-Scan Views
Click on any mission to open its detail view. For each scan you can view:
- Flight Path Map — the exact GPS track the drone flew
- Heat Map Overlay — sensor readings visualized over Google Maps satellite imagery, with red/warm tones indicating the highest-probability target locations