Export to Surfer & Google Earth
DroneRover combines intelligent mapping, autonomous flight, and real-time 3D visualization so you can detect buried metallic and non-metallic objects from the sky. Whether you're searching for hidden chests, ancient relics, tunnels, graves, or geological anomalies, DroneRover delivers instant insights directly to your smartphone or tablet as the drone flies.
This guide shows how to take the CSV data exported from the DroneRover app and bring it into Golden Software Surfer for 3D contour mapping, and then overlay the result on Google Earth.
Step 1 — Export CSV from DroneRover
- Complete an automated or manual scan with the DroneRover app.
- Tap the share icon (upload arrow) on the main screen.
- Select Share CSV.
The exported file contains three columns: long (longitude), lat (latitude), and value (sensor reading).
Part A — Visualize in Surfer
Step 2 — Install Surfer
Download and install Golden Software Surfer from: https://www.goldensoftware.com/products/surfer
Step 3 — Load the CSV
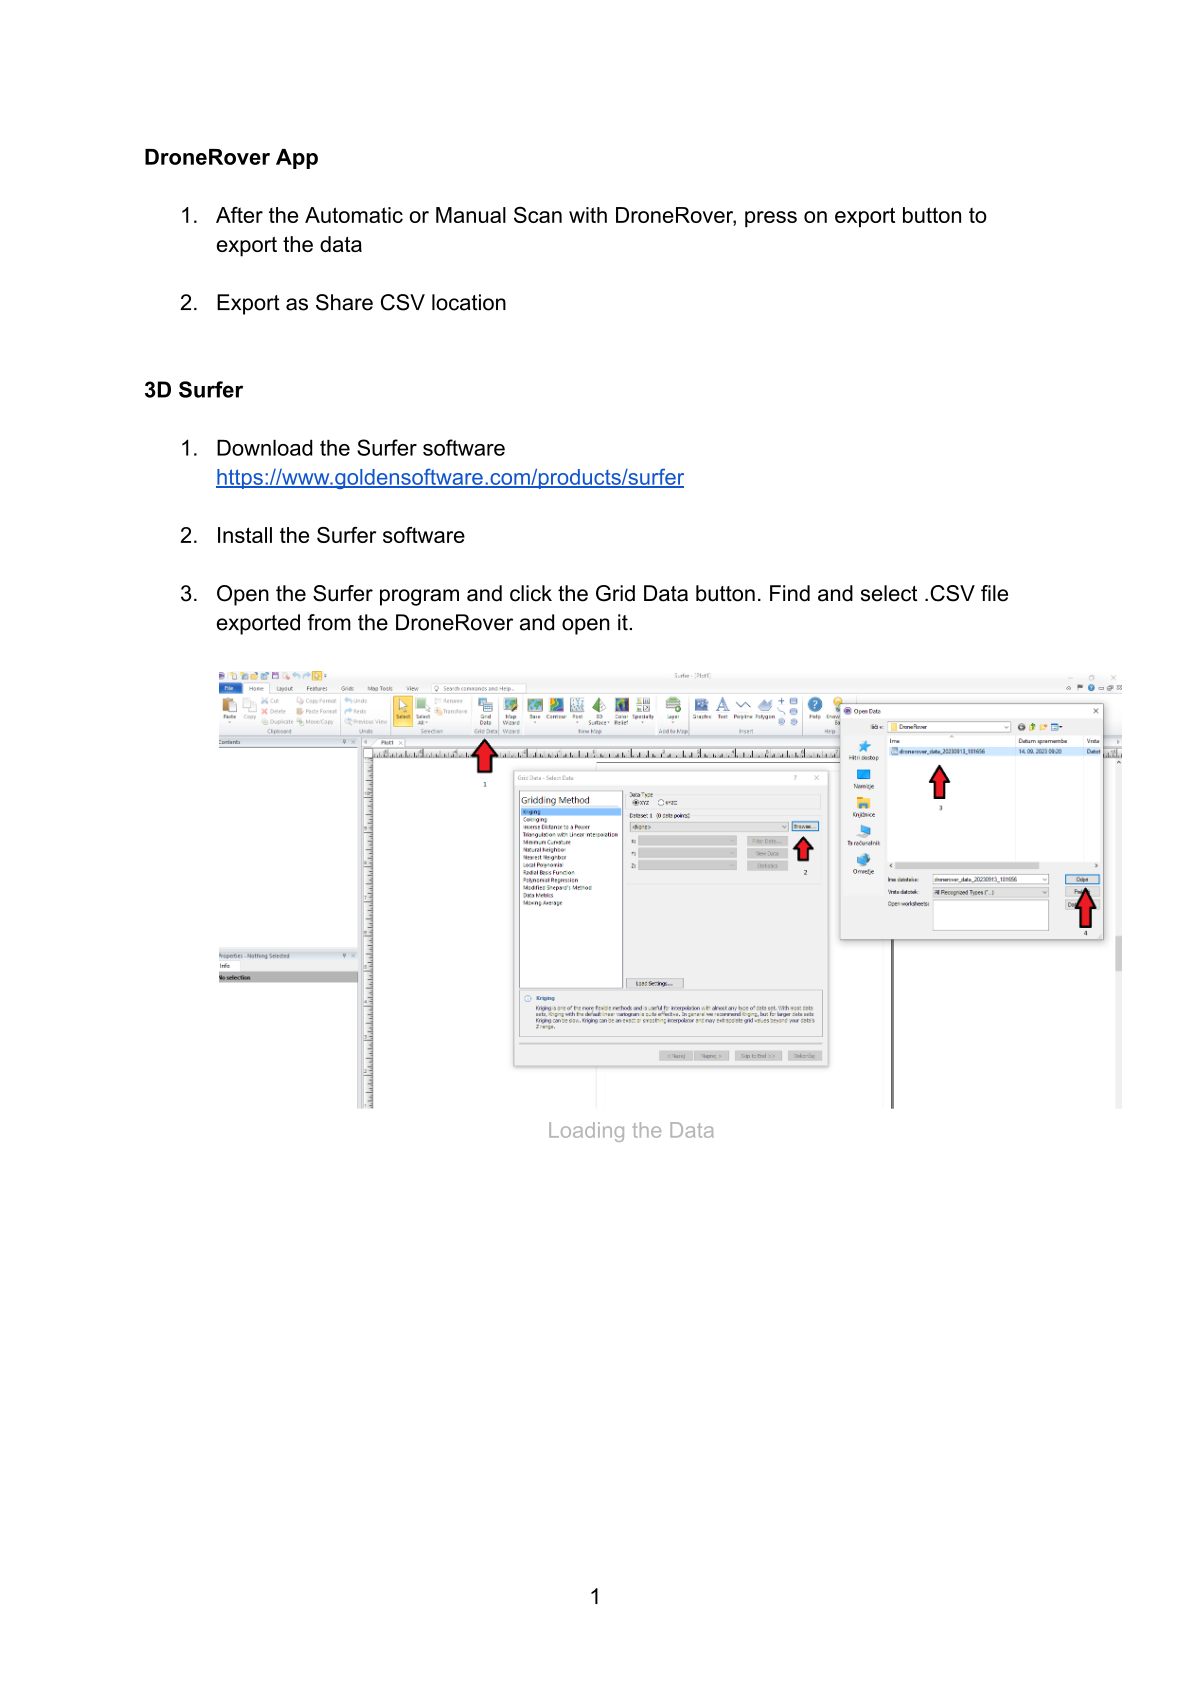
- Open the Surfer program.
- Click the Grid Data button in the toolbar.
- Browse to your exported
.csvfile and open it.
Step 4 — Map the Data Columns
In the Grid Data — Select Data dialog, assign the columns as follows:
| Axis | Column | Field |
|---|---|---|
| X | Column A | long (Longitude) |
| Y | Column B | lat (Latitude) |
| Z | Column C | value (Sensor reading) |
Click OK to convert the data. Surfer will generate a grid file from your scan.
Step 5 — Add Color to the Map
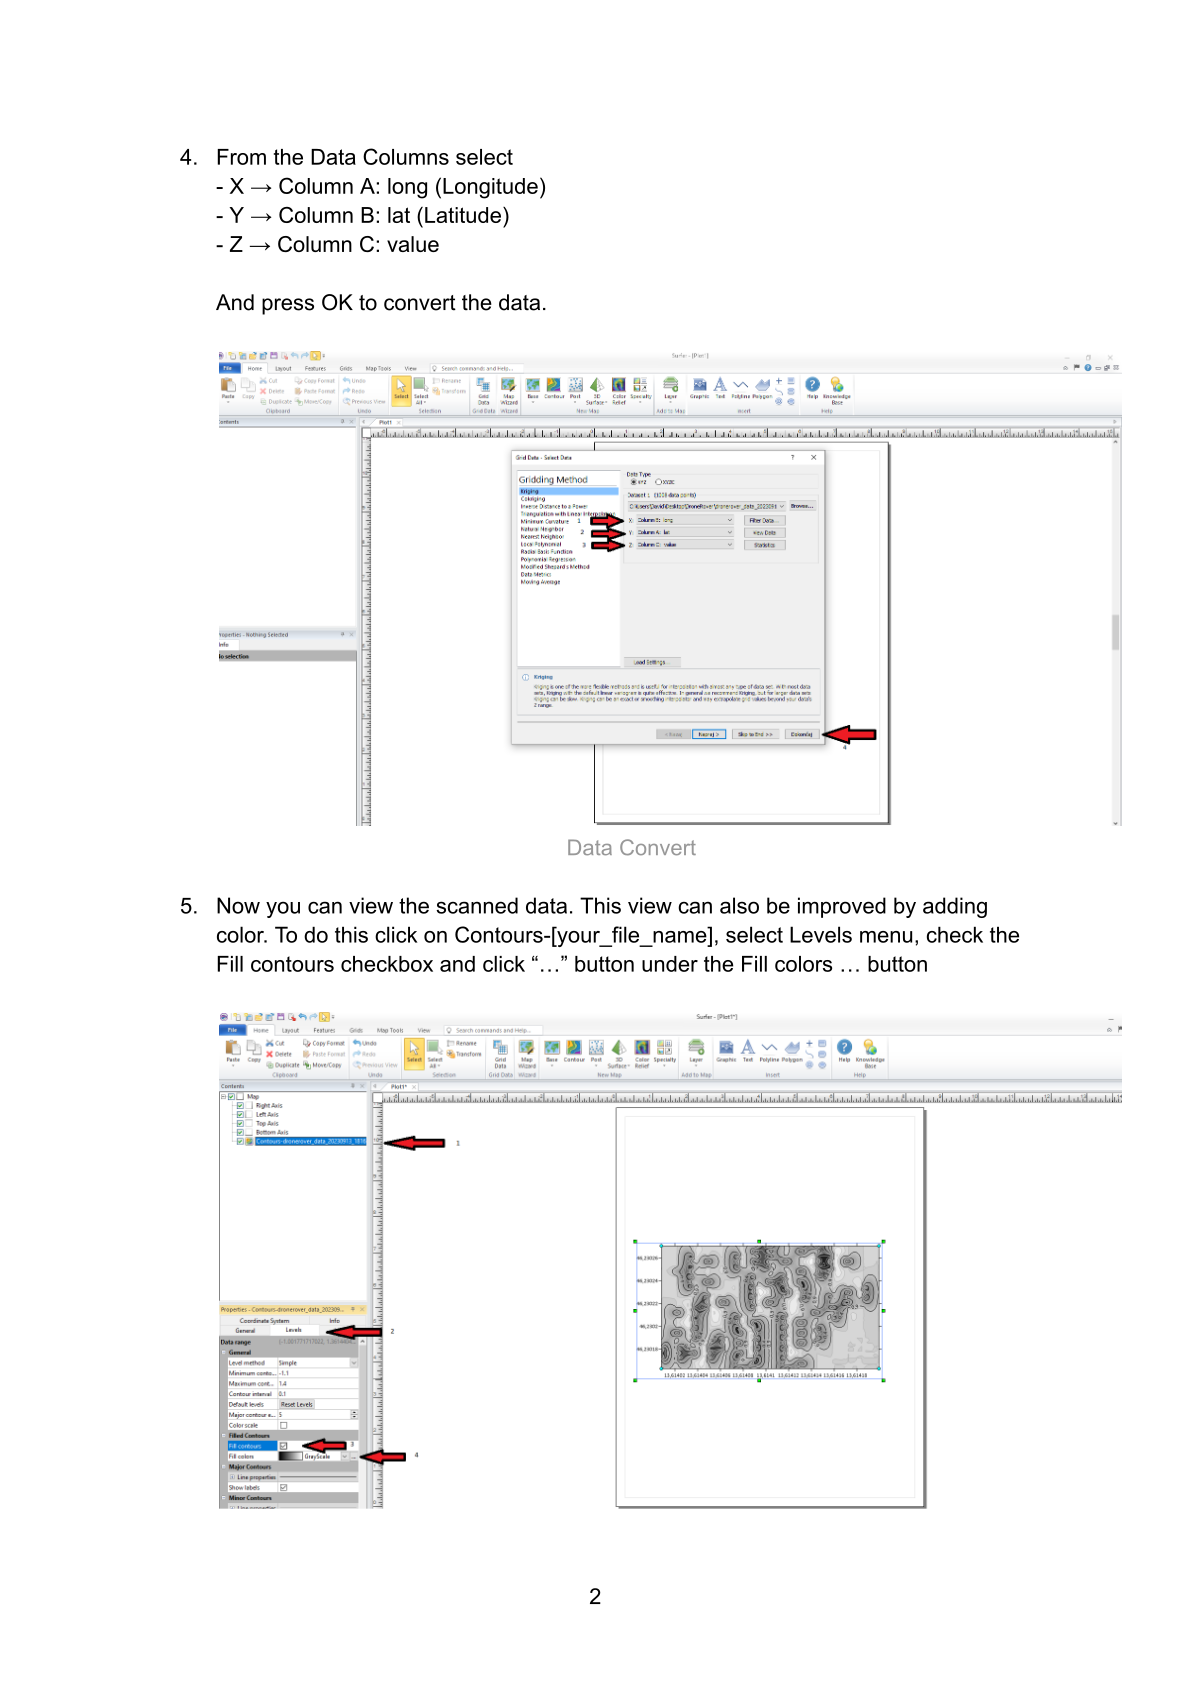
The default contour view uses lines only. To add a color fill:
- In the Contents panel, click on Contours — [your file name].
- Select the Levels tab in the Properties panel.
- Check the Fill contours checkbox.
- Click the "…" button next to Fill colors.
Step 6 — Apply Rainbow Colors
- In the Colormap Editor, select Rainbow from the Presets dropdown.
- Click the Reverse button so that high sensor values (strongest detections) appear in red/warm tones.
- Click Apply, then OK.
Your scan is now displayed as a color-filled contour map — red and yellow areas indicate the highest probability of underground objects.
Step 7 — View in 3D (Optional)
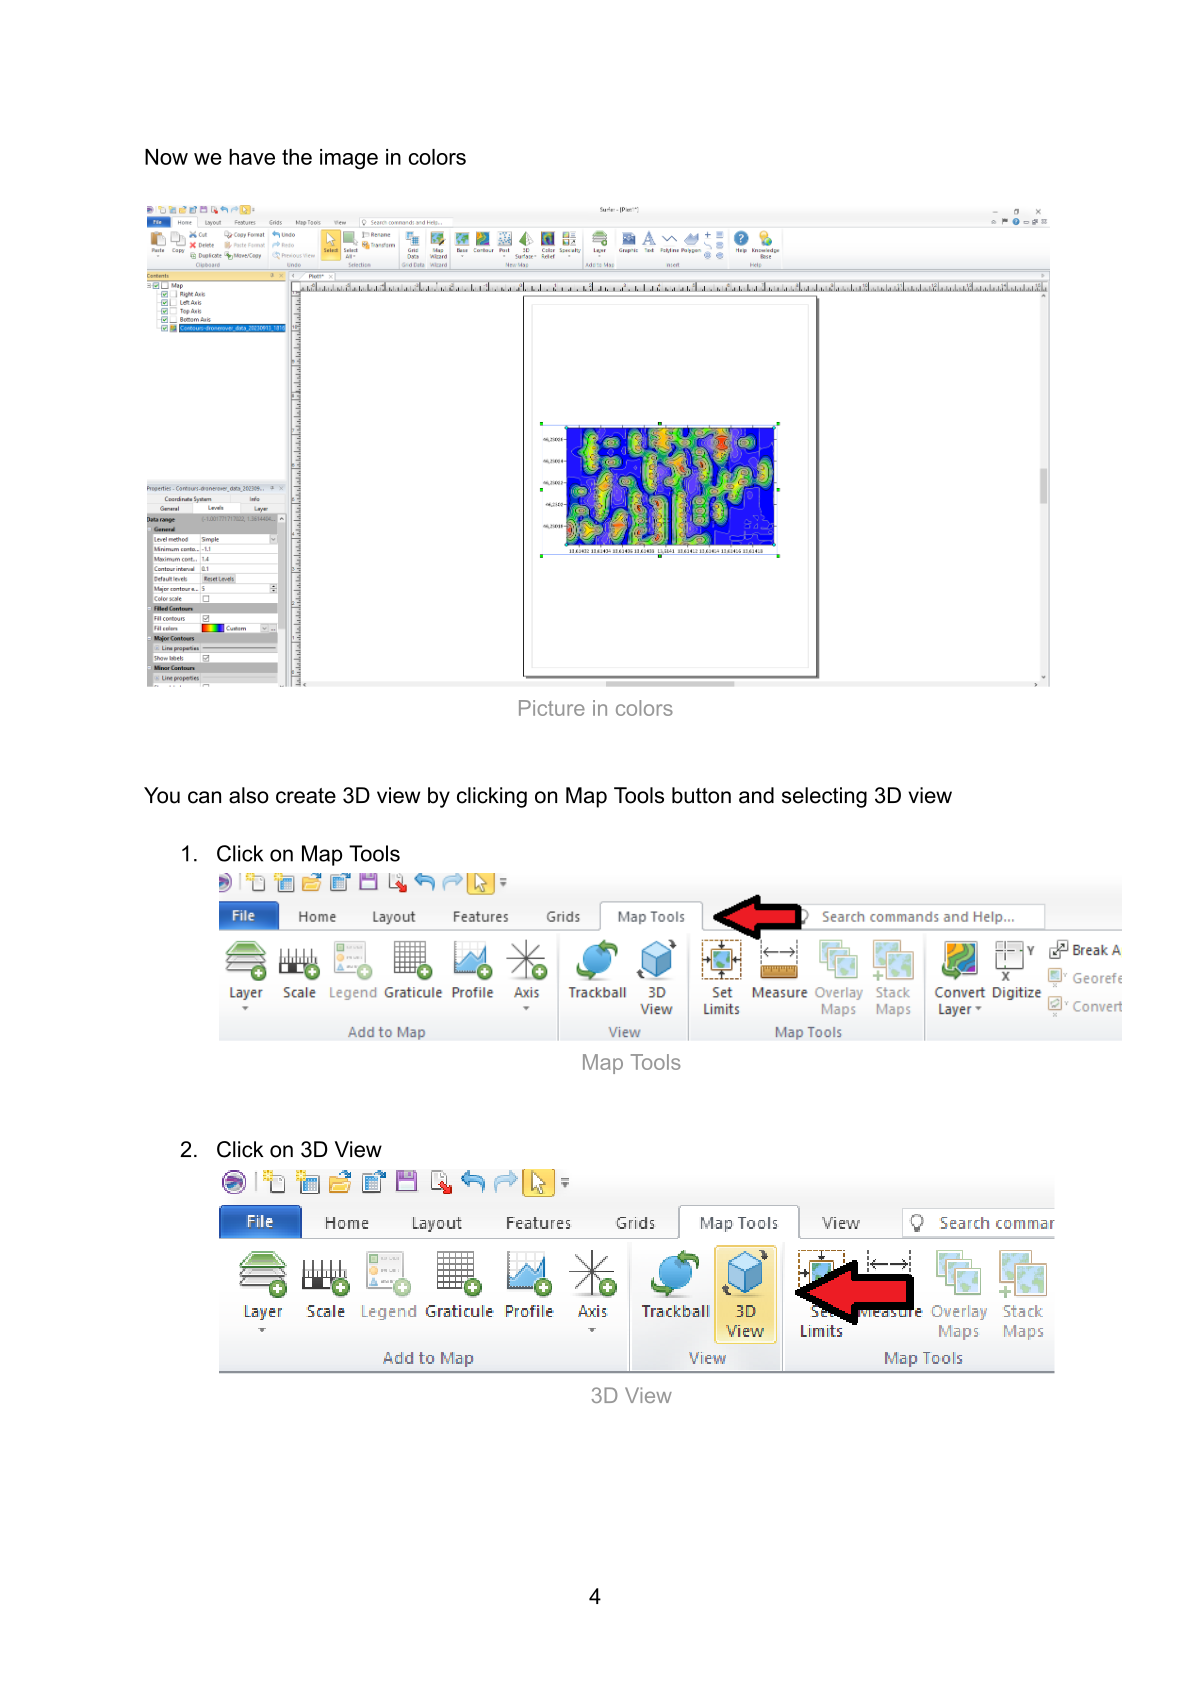
- Click the Map Tools tab in the top menu.
- Click 3D View.
You now have a full 3D terrain visualization of your scan data.
Part B — Export to Google Earth
Step 8 — Prepare the Map for Export
Before exporting, clean up the map so only the colored scan appears (no axes or labels):
8a. Uncheck axes in the Contents panel
In the Contents panel, uncheck all four axis boxes:
- Right Axis
- Left Axis
- Top Axis
- Bottom Axis
Leave only Contours — [your file name] checked.
8b. Set contour lines to Invisible
- Click on Contours — [your file name] in the Contents panel.
- Go to the Levels tab in the Properties panel.
- Expand Major Contours → Line properties and set Style to Invisible. Uncheck Show labels.
- Repeat for Minor Contours → Line properties: set Style to Invisible and uncheck Show labels.
Step 9 — Export as KML
- Click File → Export.
- Enter a file name (e.g.,
DroneRover_GoogleEarth). - Set File type to KML Google Earth KML (*.kml).
- Click Save.
- In the Export Options dialog, verify that Scaling source is set to:
Map: Contours-[your_file_name] - Click OK.
Step 10 — Open in Google Earth
- Open Google Earth in your browser: https://earth.google.com/
- Click the Projects icon in the left sidebar.
- Select Import KML file from computer.
- Browse to and select your exported
.kmlfile.
Your DroneRover scan is now overlaid on Google Earth satellite imagery, with red/yellow hotspots showing the highest-probability target locations.
The final overlay places your colored scan heatmap exactly on the real-world terrain, making it easy to navigate to and mark target locations for ground investigation.